The UK curry index is a simple idea: track what a standard curry costs over time and use it to see what is happening to food prices. It borrows from the well-known Big Mac Index, but swaps a burger for a dish that sits at the heart of British eating. Almost everyone has ordered one, cooked one or paid for one at a takeaway.
Official inflation figures can feel distant. A percentage on the news does not always match what you pay at the till or on the delivery app. A curry is different. It has rice, oil, dairy, meat, spices, energy and labour in it, so its price moves for many of the same reasons that your weekly shop does.
This guide explains where the idea comes from, five ways a UK curry index helps you read food inflation, and how to build a basic version yourself. We are also honest about its limits. It is a handy lens, not an official statistic.
Table of Contents
What the UK Curry Index Is and Where the Idea Comes From
The Big Mac Index was created by The Economist in 1986 as an informal way of measuring purchasing power parity between currencies. The logic is simple. A Big Mac is made to the same recipe in many countries, so its price in each place gives a rough guide to whether a currency looks cheap or dear. You can read the background on Wikipedia’s Big Mac Index page.
For a current example, a Big Mac in the UK costs £5.49 as of July 2026. On that basis, the pound appears 1.11% undervalued against the US dollar, according to Truflation. That is one burger telling a story about money.
A UK curry index works in the same spirit, but for a different purpose. Instead of comparing currencies, it compares prices across time. You pick one standard curry meal, price it the same way each month, and watch the line move. There is no official curry index published by the government. What we describe here is an informal method, in the same way the original Big Mac Index was informal.
Two versions of the UK curry index idea
There are two ways to build it. The first is a home-cooked basket, where you price the ingredients for a chicken curry with rice from a supermarket. The second is a menu price index, where you record what a standard curry and rice costs at a few local restaurants or takeaways.
Both are useful, and they tell you slightly different things. The basket shows ingredient costs. The menu version shows how businesses pass those costs on to customers.
Why Curry Makes a Good Inflation Lens
A curry is a mix of exactly the items that have caused the most pain in recent years. Food inflation has pushed up the price of cooking oil, dairy, rice and meat in UK curry kitchens, which are energy-intensive by nature, according to the British Curry Network. That mix of ingredients and energy use is what makes a UK curry index so revealing.
Think about what goes into one plate:
- Rice, a staple that many households buy every week.
- Cooking oil, which was hit hard by supply problems in recent years.
- Dairy, such as yoghurt, cream or ghee.
- Meat or vegetables, the biggest cost in most dishes.
- Energy, because tandoors, hobs and extraction fans run for hours.
- Labour, as skilled cooks are not cheap to hire.
A single burger has fewer moving parts. A curry captures food costs, energy costs and wages in one price. That is why it makes a rounded lens for everyday inflation. It is also a meal people care about. Most of us have a rough memory of what a Friday night curry used to cost, which makes changes easy to feel and easy to discuss.
5 Ways the UK Curry Index Reveals Food Inflation Trends
Here are the five main things a UK curry index can show you. Each one links to a real figure from an official or industry source, so you can check the bigger picture yourself.
Way 1: It shows the peak and the cooling
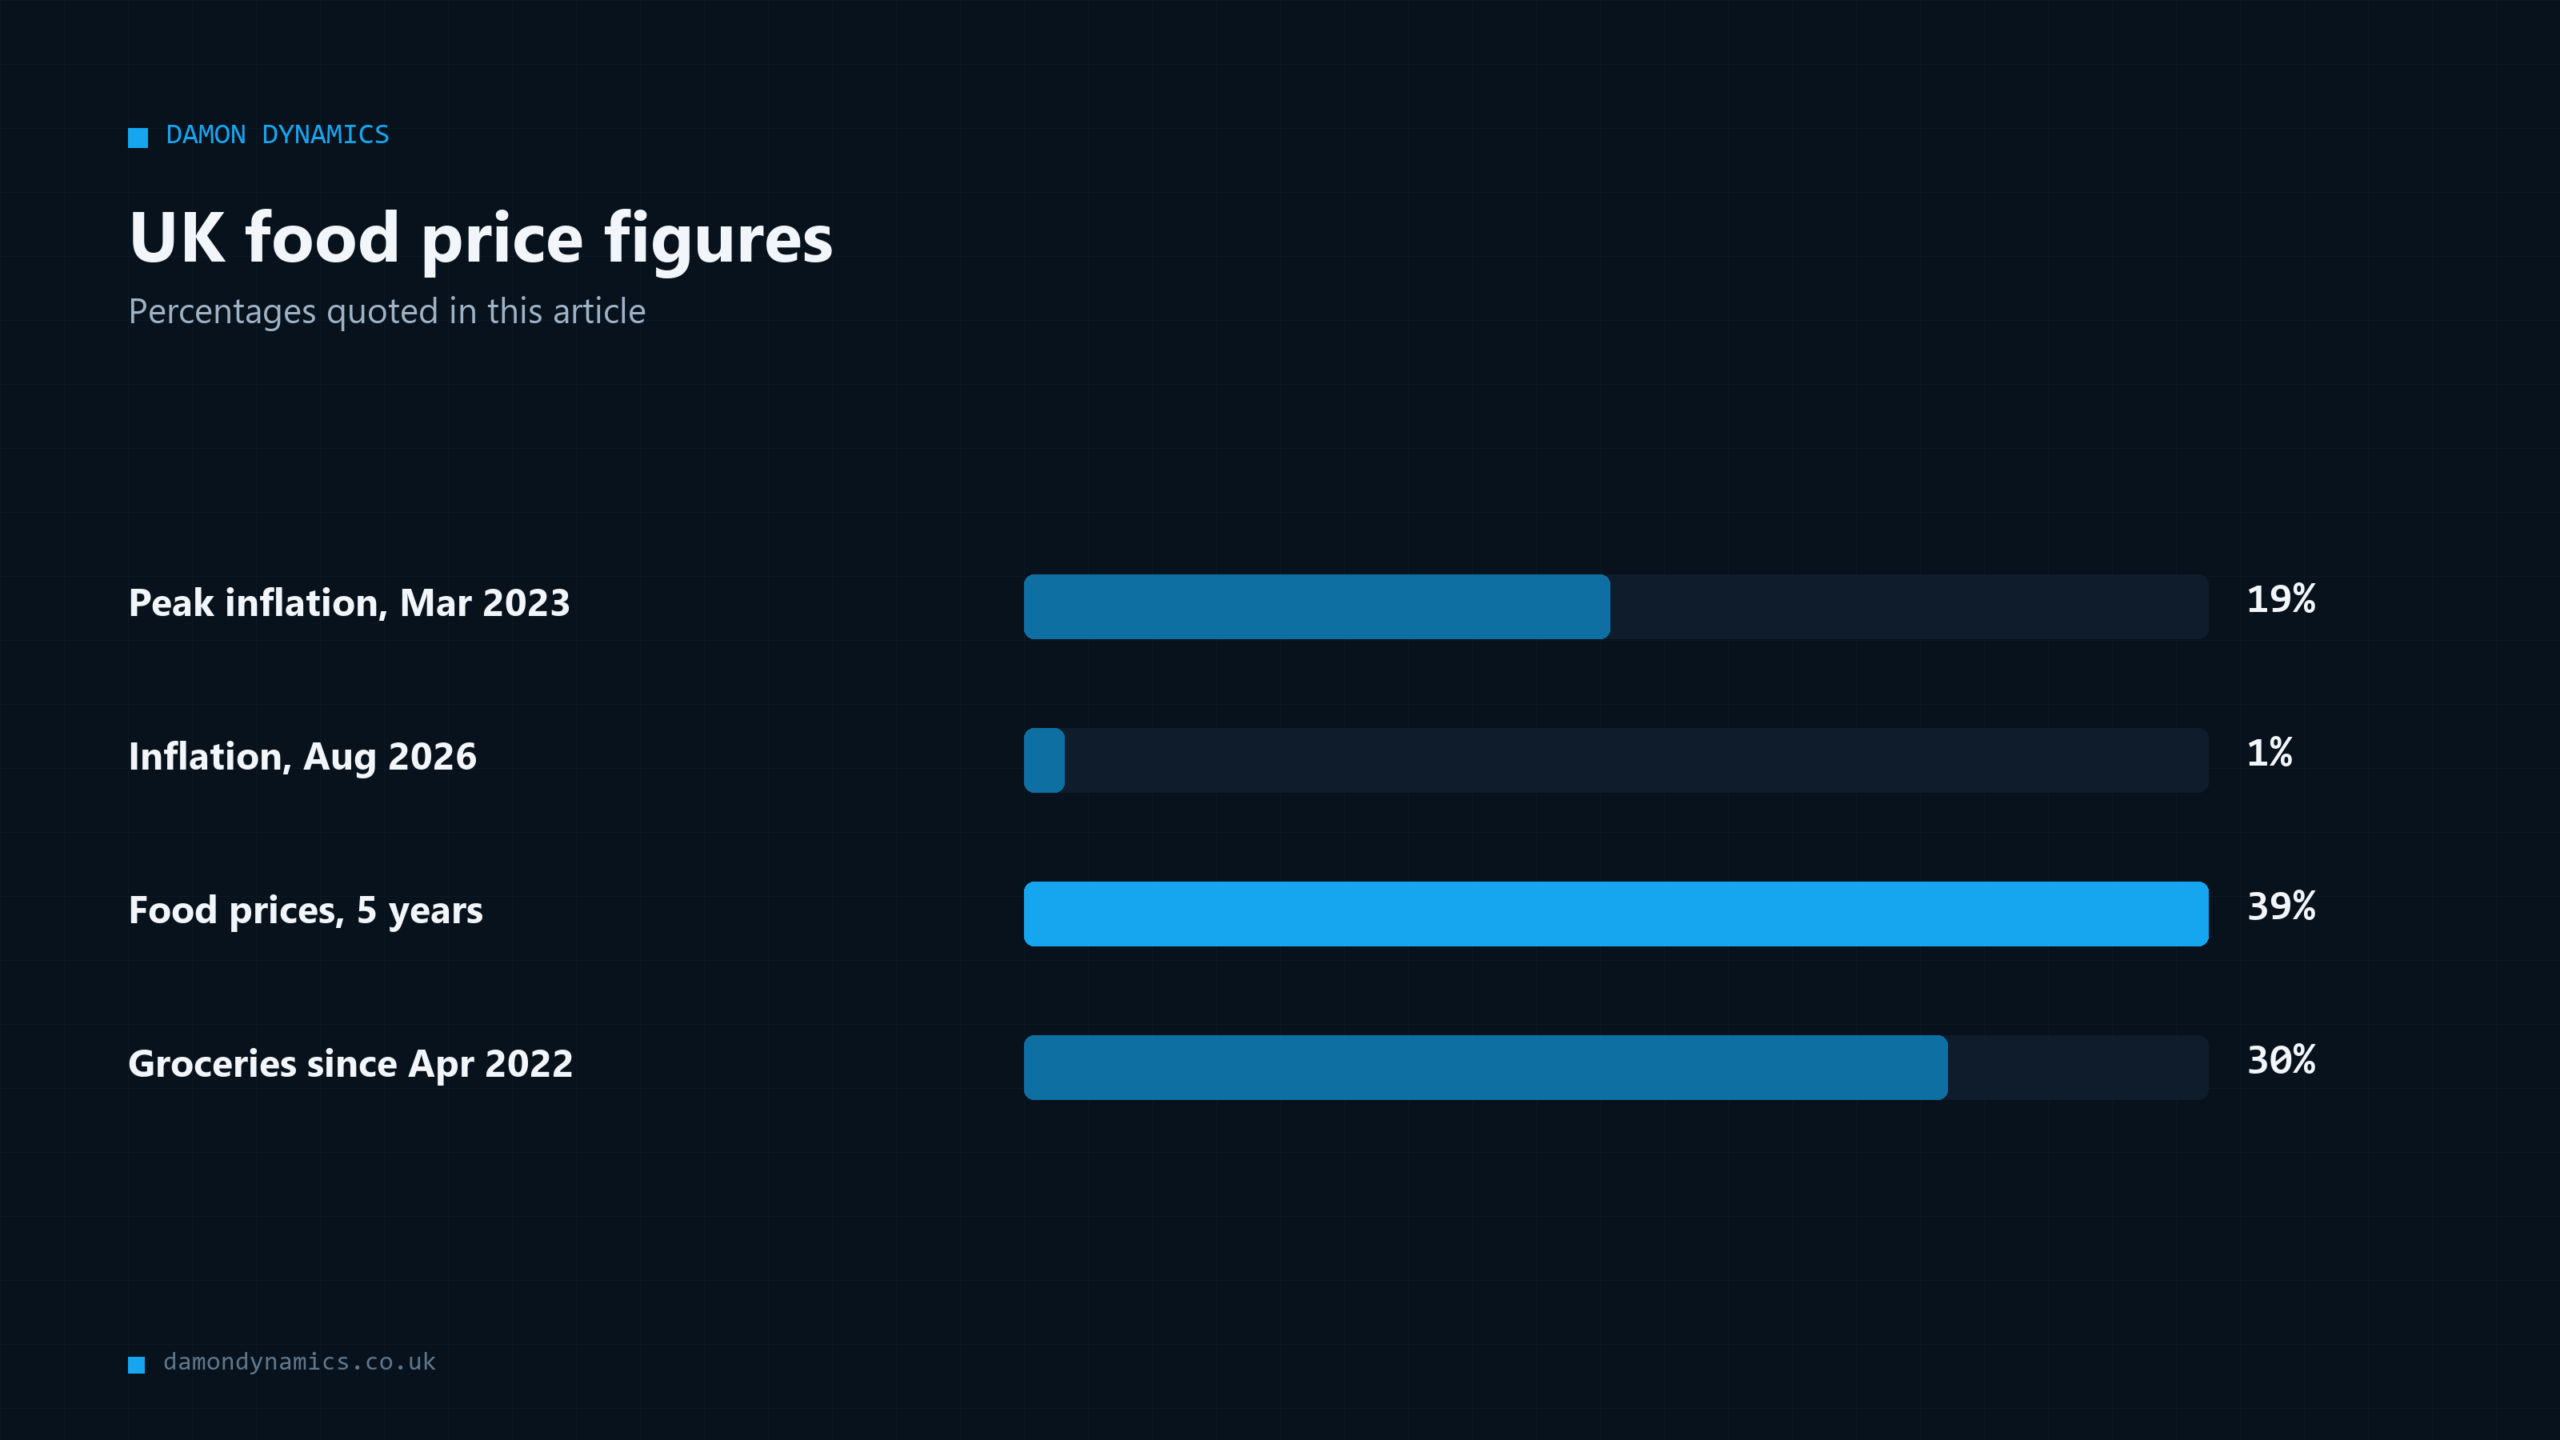
UK food and non-alcoholic beverage inflation stood at 1.3% in August 2026, down from a historic peak of 19.1% in March 2023, according to the Office for National Statistics data reported by Statista. That is a huge swing in a short time.
If you had tracked a UK curry index basket through that period, you would have seen the line climb steeply and then flatten. A UK curry index makes that curve visible in pounds and pence rather than percentages. The important point is what the cooling means. A falling inflation rate does not mean prices are falling. It means prices are rising more slowly.
Way 2: It shows the price level, not just the rate
Rates tell you the speed. Levels tell you where you ended up. UK food prices rose by a total of 38.6% between November 2020 and November 2025, with most of the increase occurring during late 2021 to mid-2023, according to the House of Commons Library. That is why people still feel squeezed even when headline inflation is low.
The jump has already happened. A UK curry index keeps your attention on the level, so you can see how far prices have moved from where they started. The same pattern shows in groceries. Prices are 30.1% higher since April 2022, according to Office for National Statistics data from July 2026, as reported by the Food Foundation. Different measures, different start dates, same message.
Way 3: It shows where costs bite hardest
Not every part of a curry rises at the same speed. Rice, oil, dairy and meat have each had their own pressures. If you track the ingredients separately, your UK curry index can show which part of the plate is driving the change.
Energy matters too. Curry kitchens are energy-intensive by nature, so gas and electricity costs feed straight into menu prices. A takeaway may keep its prices steady for a while, then raise them in one go when a fixed energy contract ends. This is useful for a business owner. If you see that one ingredient is moving far faster than the rest, you know where to look for savings, substitutes or supplier talks.
Way 4: It shows how consumers change behaviour
Prices do not just change what things cost. They change what people do. The British Curry Network reports that the undifferentiated mid-market curry house that thrived for forty years is contracting. Distinctive regional-Indian openings, premium dining and delivery-led operations are expanding.
That is a spending story. When prices rise, people tend to split into two groups. Some trade down to cheaper options or cook at home. Others spend less often but choose a better experience when they do go out. A UK curry index helps you see the pressure behind that shift. If the price of an ordinary plate climbs, the case for a forgettable middle-of-the-road meal gets weaker.
Places that offer something distinctive, or the convenience of delivery, have a clearer reason to exist. We should be careful here. A price index shows pressure, not proof. Many things shape where people eat, including taste, location and trends.
Way 5: It lets you compare places and shops
The original Big Mac Index compares countries. A UK curry index can compare towns, shops or suppliers in the same way. If the same basket costs noticeably more in one place than another, that gap is worth understanding.
You might compare a large supermarket, a discounter and a local Asian grocer. Or you might compare menu prices across Leeds, Bradford and Huddersfield. The point is not to crown a winner. It is to see how much of the price is the ingredient and how much is the setting. Over time, you can also compare your own basket against the official figures. If your curry costs rose faster than the headline rate, your basket is more exposed to the items that have moved most.
How to Build Your Own UK Curry Index Basket
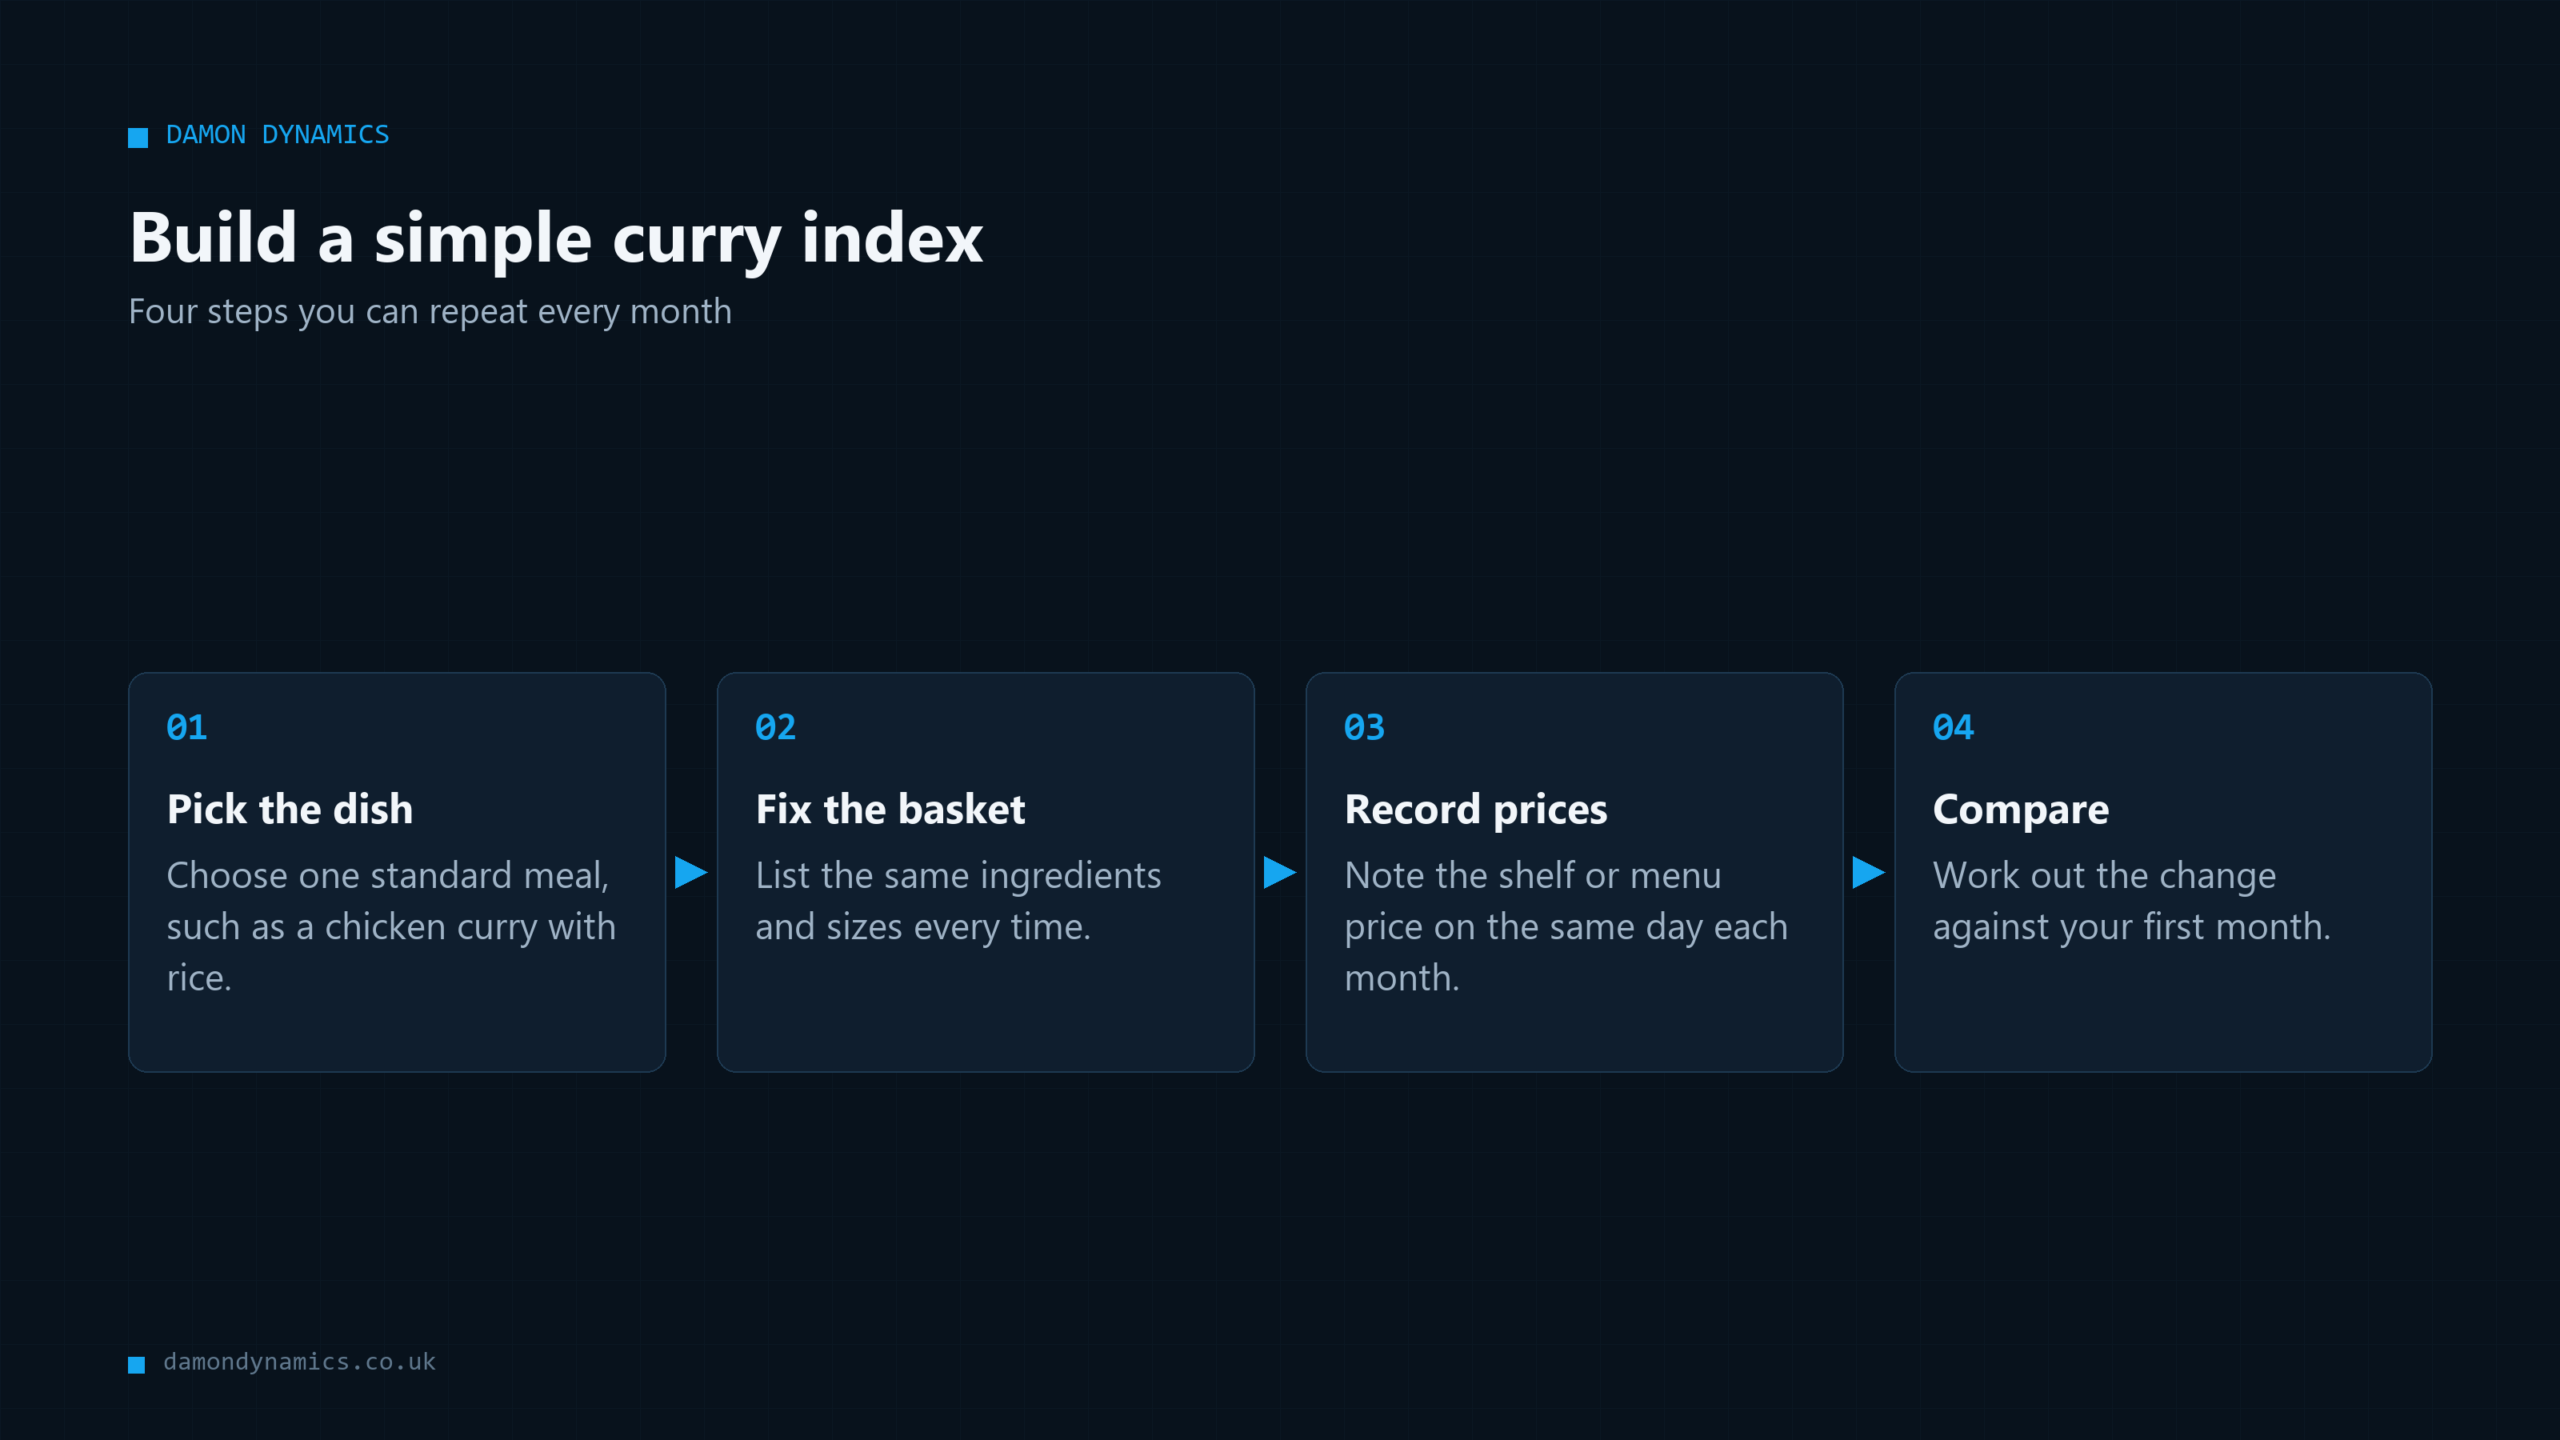
You do not need special software to start. A spreadsheet and ten minutes a month will do. The key is consistency, because a basket that changes every time tells you nothing.
- Choose one dish. A chicken curry with rice for four people is a good start.
- List fixed quantities. For example, 500g of chicken, 300g of rice, one tin of tomatoes, one tub of yoghurt, a small bottle of oil and a pack of spices.
- Pick one or two shops. Use the same ones every time.
- Record the price on the same day each month. Note the date, the pack size and any offers.
- Calculate the total. Compare it with your first month.
A worked example
The table below uses made-up round numbers to show how the calculation works. These are examples only, not real prices.
| Month | Example basket cost | Change from month 1 |
|---|---|---|
| Month 1 | £10.00 | 0% |
| Month 6 | £10.50 | 5% |
| Month 12 | £11.00 | 10% |
| Month 18 | £11.20 | 12% |
In this example, the basket rose by 12% over 18 months. You would then ask what drove it. Was it the chicken, the rice or the oil? Splitting the basket into lines answers that question.
Adding a menu price line
If you want the restaurant side, add a second sheet. Record the price of a standard curry and rice at three local places. Use the menu price, not delivery app prices, because apps often add their own mark-ups. Keep the two sheets separate. The gap between them is interesting, but it mixes ingredients, labour, rent and profit, so do not read too much into it.
The Limits of a UK Curry Index
A UK curry index is a useful lens, but it is easy to over-claim. Here is what it cannot do.
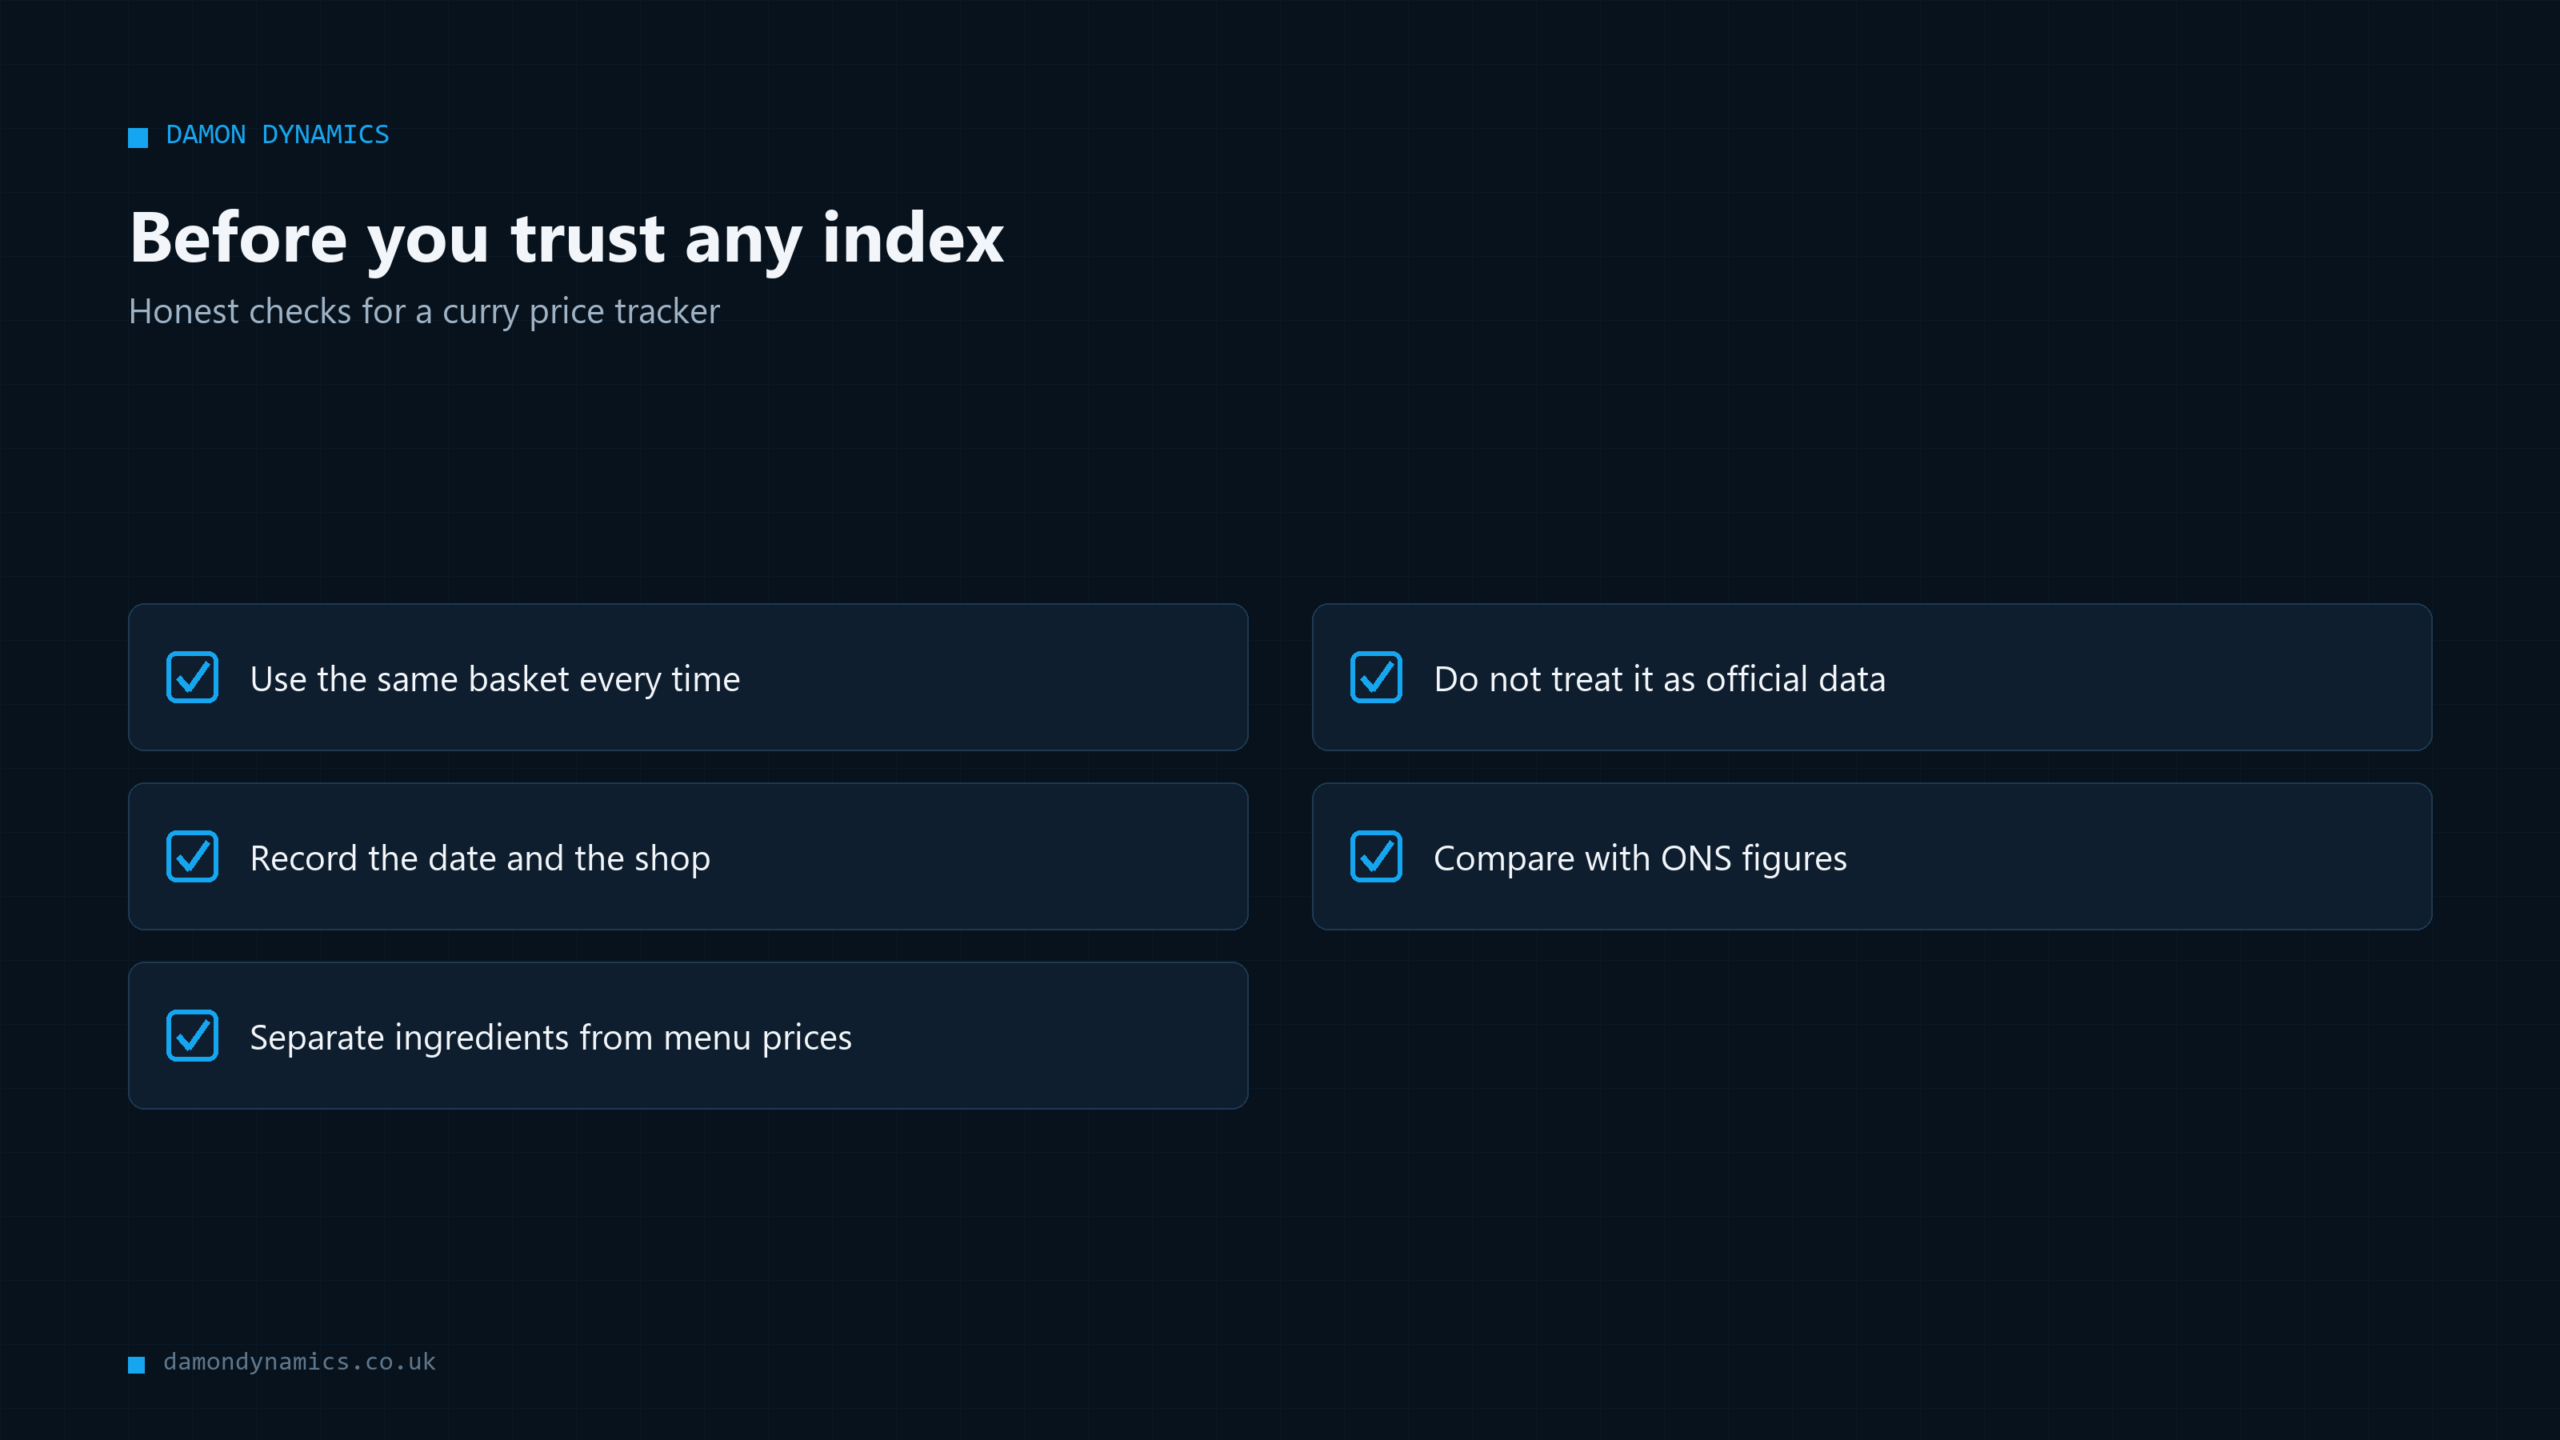
It is not official. The Office for National Statistics uses a far larger and more careful basket. It is small. A few items and a few shops cannot represent the whole country. It is affected by offers. A promotion in one month can distort the line. It mixes causes. A higher price might come from ingredients, energy, wages or rent. Quality changes. If a shop swaps a product or shrinks a pack, your UK curry index basket may not notice.
The Big Mac Index has similar critics. It is best seen as a conversation starter, not a precise measure. The same goes for a UK curry index.
Use it alongside the real data
The best approach is to use your own basket next to the official figures. If your numbers move broadly in line with the Office for National Statistics data, you can feel more confident. If they differ, work out why before drawing conclusions. That habit, checking a simple measure against a trusted one, is a good rule for any data work.
What a UK Curry Index Means for Small Businesses
If you run a restaurant, takeaway, café or food shop, a UK curry index is more than a talking point. It is a cheap way to watch your own costs and spot trouble early. Many owners only look at costs when the bank balance feels tight. A monthly basket check gives you an earlier warning.
If your key ingredients are up 8% and your menu prices have not moved, your margin is shrinking. Here is how to use it in practice:
- Review menu prices at set times, such as every quarter, rather than only in a crisis.
- Ask suppliers about the lines that have risen fastest.
- Test alternatives for ingredients with big swings, if quality allows.
- Watch competitors, in case they are changing prices or moving towards delivery or premium dining.
Where AI can help, and where it cannot
Doing this by hand is fine for one basket. It gets tedious when you track dozens of products across many suppliers. That is where automation can help by collecting prices on a schedule and putting them in one place. Our guide to AI price tracking in the UK covers the practical options.
AI is not the answer to everything, though. If you only need to price five items once a month, a spreadsheet is cheaper and simpler. Automation makes sense when the task is repeated, rule-based and eating hours of someone’s week. Our article on AI automation for small business lists the jobs that are usually worth doing first.
If you are weighing up a tool more generally, our guide to choosing an AI assistant for a small business explains what to check before you buy.
How Damon Dynamics Helps With Price Data
Damon Dynamics is an AI engineering company in Bradford, West Yorkshire. We work with businesses across Yorkshire, including Leeds, Halifax, Huddersfield, Wakefield and Keighley, and remotely anywhere in the UK. The company is run by Damon, who holds an MSc in Artificial Intelligence and Data Science from the University of Hull. He builds every project himself, so you talk to the engineer, not a sales team.
For a business that wants to track costs, we build data dashboards and automation pipelines. A typical job might collect supplier prices on a schedule, tidy them up and show the trends on one screen. We also build AI assistants grounded in a business’s own documents that cite their sources. You can see the range on our services page.
Our approach is deliberately plain:
- A free 30-minute discovery call.
- A fixed written quote, with no day rates.
- One workflow first, as a fixed-price project.
- A human approves anything customer-facing.
- Everything is documented and handed over, so there is no lock-in.
We also run live products, such as Plainly Benefits and WaitWell, which you can read about on our products page. They show how we build tools that answer from trusted sources. If you want to talk through a cost-tracking idea, even a small one, we will tell you honestly whether it needs AI at all.
**Book a free 30-minute discovery call**
Frequently Asked Questions
What is the UK curry index?
It is an informal way to track food inflation by pricing a standard curry meal over time. It borrows the idea from the Big Mac Index, which The Economist created in 1986. It is not an official statistic, but a personal or business tool.
Is there an official curry index published in the UK?
No. The Office for National Statistics publishes official inflation data using a much larger basket of goods. A curry-based measure is a personal or business tool that sits alongside those figures.
Why use curry rather than a Big Mac?
A curry contains rice, oil, dairy, meat, energy and labour, so it reflects a wider mix of costs. It is also a familiar British meal. The Big Mac Index suits comparing currencies, while a UK curry index suits watching local food costs.
Is UK food inflation still high in 2026?
The rate has cooled a lot. Food and non-alcoholic beverage inflation was 1.3% in August 2026, down from a peak of 19.1% in March 2023. However, prices are still much higher than they were a few years ago.
How often should I update my curry basket?
Once a month is enough for most people. Pick the same day and the same shops each time. Consistency matters more than frequency.
Can a curry index help my restaurant set prices?
It can help you spot rising ingredient costs early. It should not set your prices alone, because rent, wages and local demand also matter. Use it as one input to a regular price review.
Do I need AI to track prices?
Not for a small basket. A spreadsheet works well. AI and automation start to make sense when you track many products across many suppliers and the manual work takes hours each week.